A/B testing is the most over-recommended and under-executed practice in ecommerce CRO. The gap is statistical literacy. Most teams can run a test, fewer can size one correctly, and fewer still can read the result without talking themselves into a number that is not there.
How much traffic do I need to run an ecommerce A/B test?
It comes down to three inputs: your baseline conversion rate, the minimum detectable effect (MDE) you actually care about, and the confidence you want. The standard frequentist calculation (Fisher 1935, restated in every CRO textbook since) lands a median ecommerce store somewhere in the tens of thousands of sessions per variant, which is where the often-quoted "about 25k sessions" rule of thumb comes from.
Two implications most teams underweight. First, a lower baseline conversion rate means more variance, which means more sessions, low-CVR stores need far more traffic than they expect. Second, the 25k figure is for the median store, not for yours; the conversion rate benchmarker tool computes the required sample size from your specific baseline and target lift.
What should I test first on an ecommerce site?
Order by leverage. The thing that touches every visitor's path beats the thing that touches a narrow slice, and removing friction beats engineering persuasion. In rough priority:
- Payment-method buttons. Apple Pay, Google Pay, Shop Pay. The largest single mobile lever; test their presence and prominence first.
- Checkout step count. Single-page versus multi-step. Some verticals win on single-page (apparel, beauty), others on multi-step with a clear progress indicator (electronics, B2B). Test it; do not assume.
- Add to Cart copy and prominence. Touches every product page.
- Hero copy on the top landing page. Specific value claim versus benefit-led versus aspirational. Benefit-led copy wins more often than not, though usually by a small margin.
- Social-proof placement on product pages. See social proof in ecommerce 2026 for the lever-by-lever breakdown.
- Form-field count at checkout. Fewer fields, fewer drop-offs.
- Trust badges and security signals at checkout. A small but reliable lift across verticals.
Save the lower-leverage tests for later: hero image variants, color palettes, font choices, header and footer redesigns, promo-banner copy. Those are usually the ones a marketing team wants to run first, because the changes are the most visible. Run the high-leverage tests anyway.
When should I stop a test?
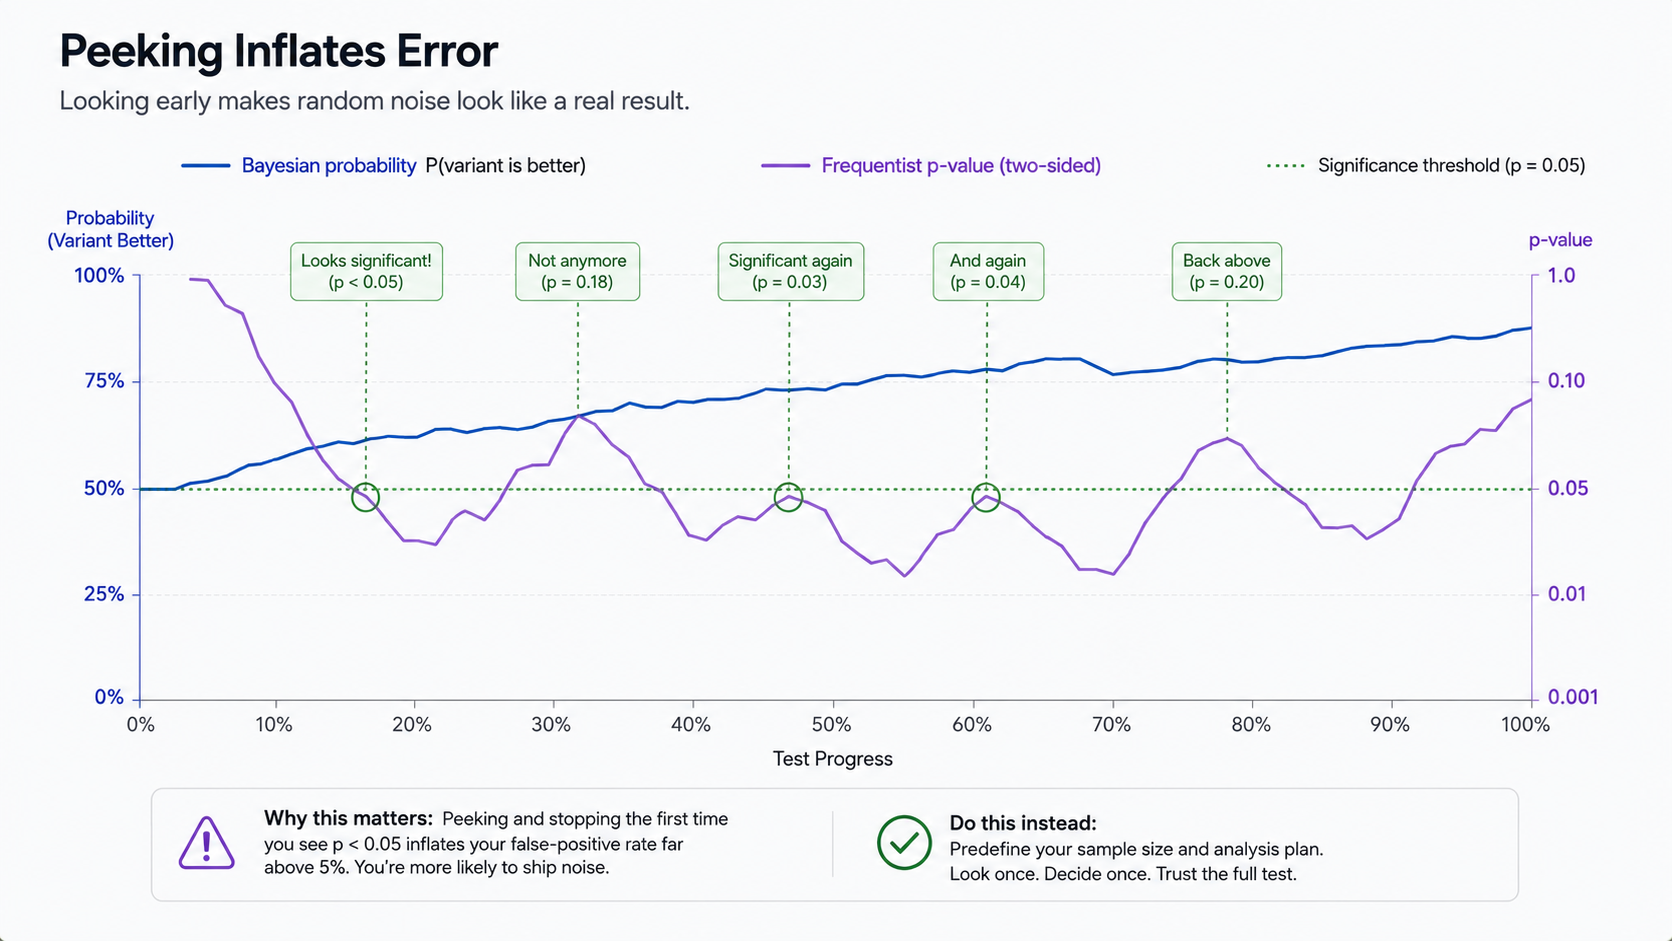
The standard answer, "when it reaches statistical significance," is wrong. Pre-commit to a sample size and a stop date before the test starts, and stop only when both are reached. Stop the first time significance flickers green and you have not run an experiment so much as consulted a Magic 8-Ball.
The reason is that peeking at p-values mid-test inflates the false-positive rate badly. A nominal 5% alpha (95% confidence) becomes an effective 15-25% if you check daily and stop the first time it crosses significance (Sequential Analysis literature, Wald 1945; replicated in the CRO context across the 2010s and 2020s).
Three concrete rules: write the stop conditions into the test brief; run for at least 14 days or two business cycles to catch novelty effects and weekly seasonality; and if you must monitor continuously, use a method built for it (Bayesian sequential, group-sequential frequentist, or always-valid p-values per Howard et al., 2021).
This is not bureaucracy. The 2024 AB Tasty replication study found 38% of early-stopped wins reverted to flat or negative on a follow-up test (AB Tasty, 2024). Pre-committing the stop conditions is the difference between learning something and reading noise.
Bayesian or frequentist for ecommerce A/B tests?
For most stores in 2026, Bayesian. It outputs the question operators actually ask, "P(B beats A) = 0.94" rather than "p = 0.03," and the second needs a translation step that introduces errors. It handles continuous monitoring more honestly, because credibility intervals do not flicker the way p-values do. And it works at smaller sample sizes with weakly-informative priors, producing an interpretable answer where a frequentist test just says "insufficient power."
The frequentist case is real too: enterprise tooling (Optimizely, VWO, AB Tasty) defaults to it, and most CRO certifications teach it first. If your team is fluent and uses pre-committed stop conditions, frequentist is fine. The discipline matters more than the framework.
| Tool | Methodology default | Tier | Notes |
|---|---|---|---|
| GrowthBook | Bayesian | Free / startup (open source) | Self-host or cloud, integrates with feature flags |
| Statsig | Bayesian | Mid-market | Server-side experimentation, feature-flag-native |
| Convert.com | Frequentist (Bayesian opt-in) | Mid-market | Strong client-side editor, Shopify-native integration |
| VWO | Frequentist (Bayesian add-on) | Mid-market / enterprise | Mature visual editor, heatmaps included |
| Optimizely | Frequentist | Enterprise | Strong stats engine, expensive |
| AB Tasty | Frequentist (sequential) | Enterprise | Personalization features bundled |
Under 100k monthly sessions, GrowthBook (open source, free to self-host) is the default 2026 pick. For higher-traffic operations with engineering capacity, Statsig is the modern choice; for marketing-led teams, Convert.com or VWO.
What is a novelty effect and how do I diagnose one?
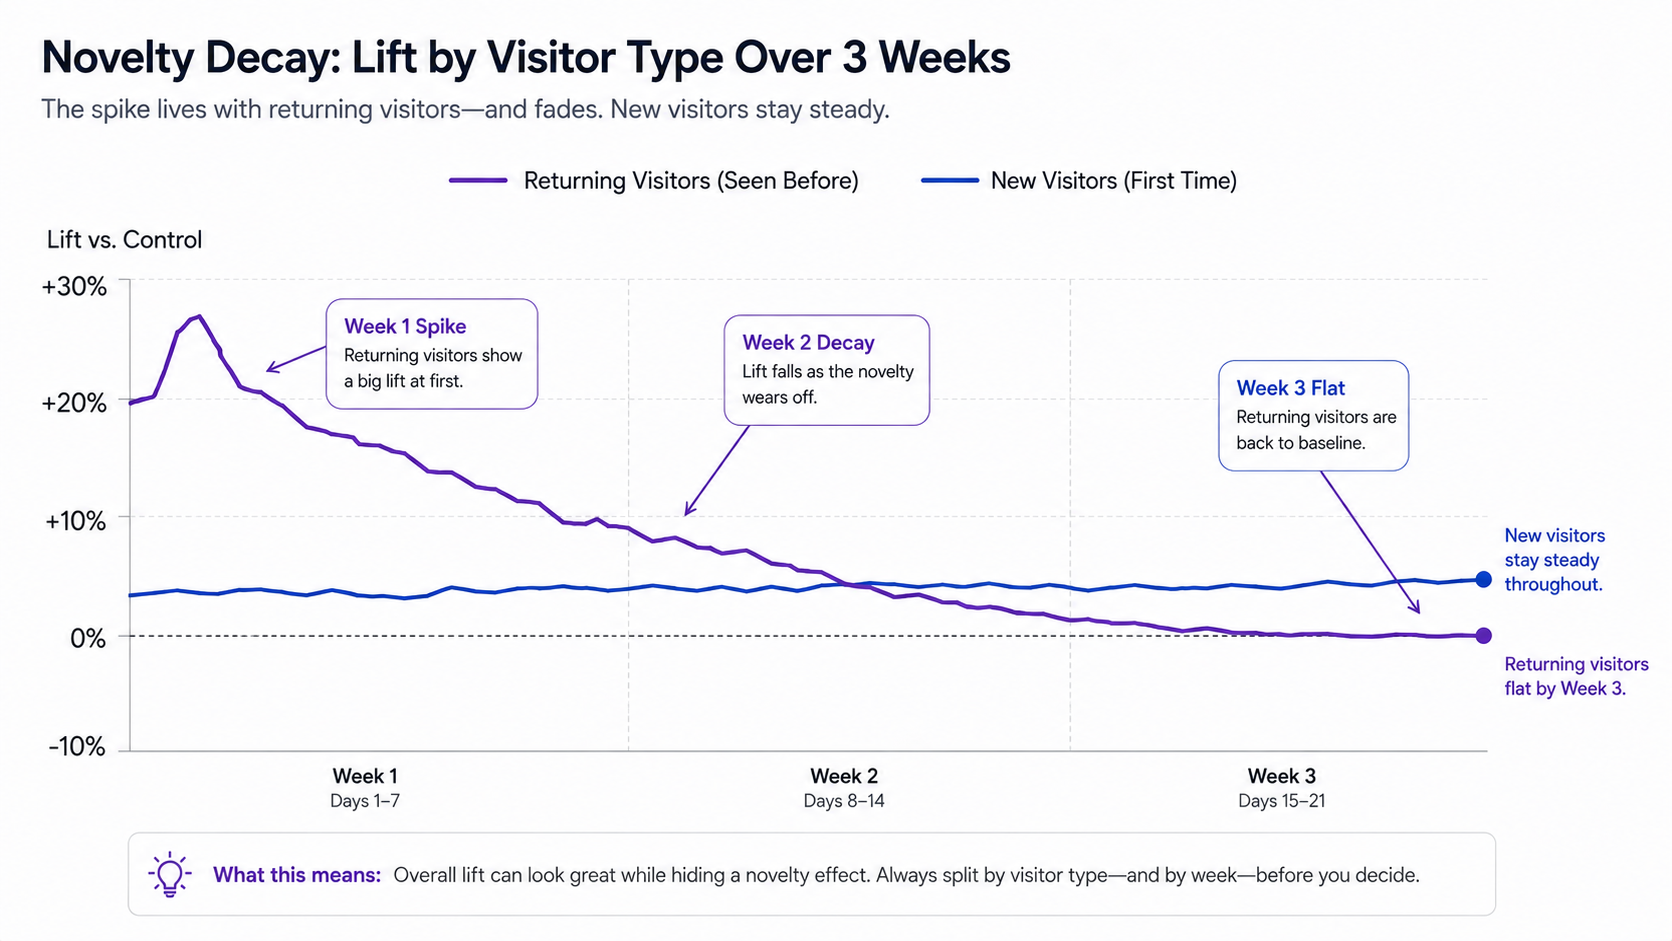
A novelty effect is a temporary lift caused by visitors noticing a change rather than the change being genuinely better. The classic case: a new homepage hero pulls 12% more clicks in week one because returning visitors notice it, then collapses to flat by week three.
Diagnosis is mechanical. Segment by new versus returning visitor, since novelty concentrates on returning visitors, and run the test long enough to see the decay, two weeks minimum, four for high-frequency-return cohorts. The Baymard 2026 cohort study found 60% of CRO tests with an apparent week-one win showed meaningful decay by week three (Baymard Institute, 2026).
The mirror image exists too, a primacy effect: returning visitors dislike the change in week one and the metric dips, then normalizes by week three as they adapt. Stopping early in either direction misreads the steady state.
What this means for an operator running A/B tests in 2026
Calculate the sample size first, then pick the test. A test you cannot statistically resolve is a waste of a slot, no matter how interesting the hypothesis. Write the stop conditions down before you start, sample size, calendar end date, success metric, and that brief is what separates learning from rationalizing.
The short version: A/B testing is statistical inference, not opinion validation. Treat it that way, size it correctly, stop it on the pre-committed terms, and the wins compound. Treat it as decoration on the design process and they evaporate.
Further reading
- ToolConversion rate benchmarkerSize the test against your baseline and traffic.
- GuideHow CRO works in 2026Where A/B testing fits in the broader CRO workflow.
- BlogEcommerce funnel analysisPicking the right step in the funnel to test.
- BlogCheckout page optimizationThe highest-leverage tests tend to live at checkout.
- GuideThe proactive-engagement referenceA high-leverage lever to test against the no-chat holdout.
Frequently asked questions
Payment buttons, checkout step count, Add to Cart prominence, hero copy, social-proof placement, and form-field count. High-leverage friction-removal tests beat persuasion-engineering tests.
Last updated June 10, 2026.