Funnel analysis is what makes a CRO decision defensible. Without it, every "we should test this" is a guess. With it, every test slot is sized against a leak you can point to.
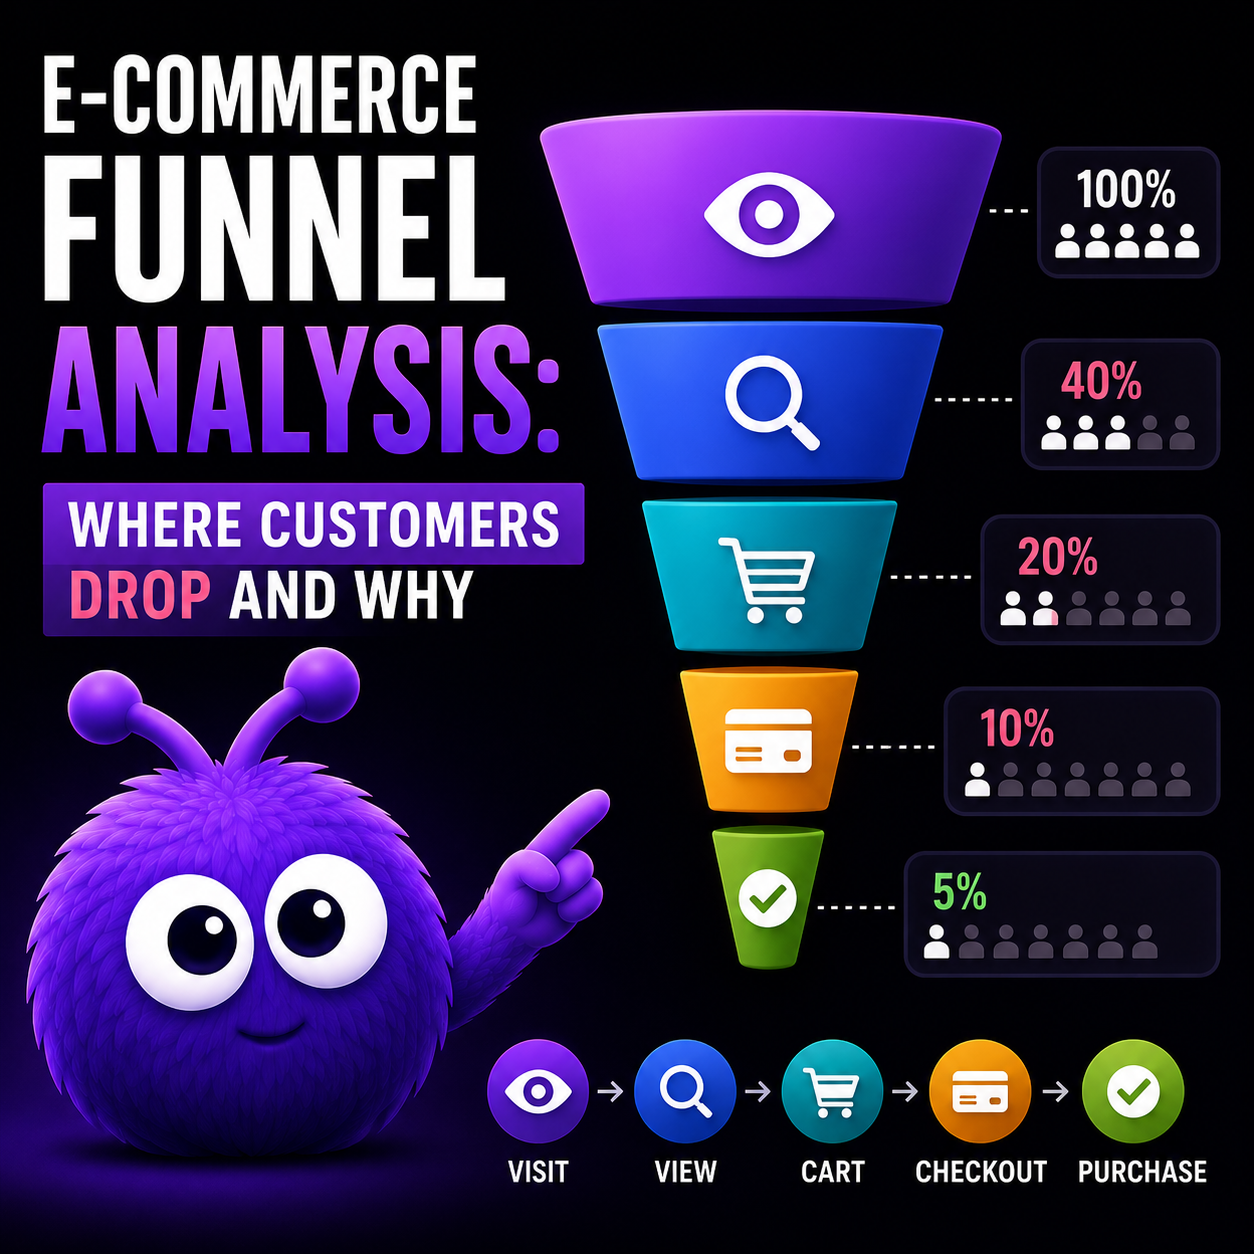
What does a typical ecommerce funnel look like in 2026?
| Stage | Share of original landing visitors | Stage-to-stage conversion | Typical drop cause |
|---|---|---|---|
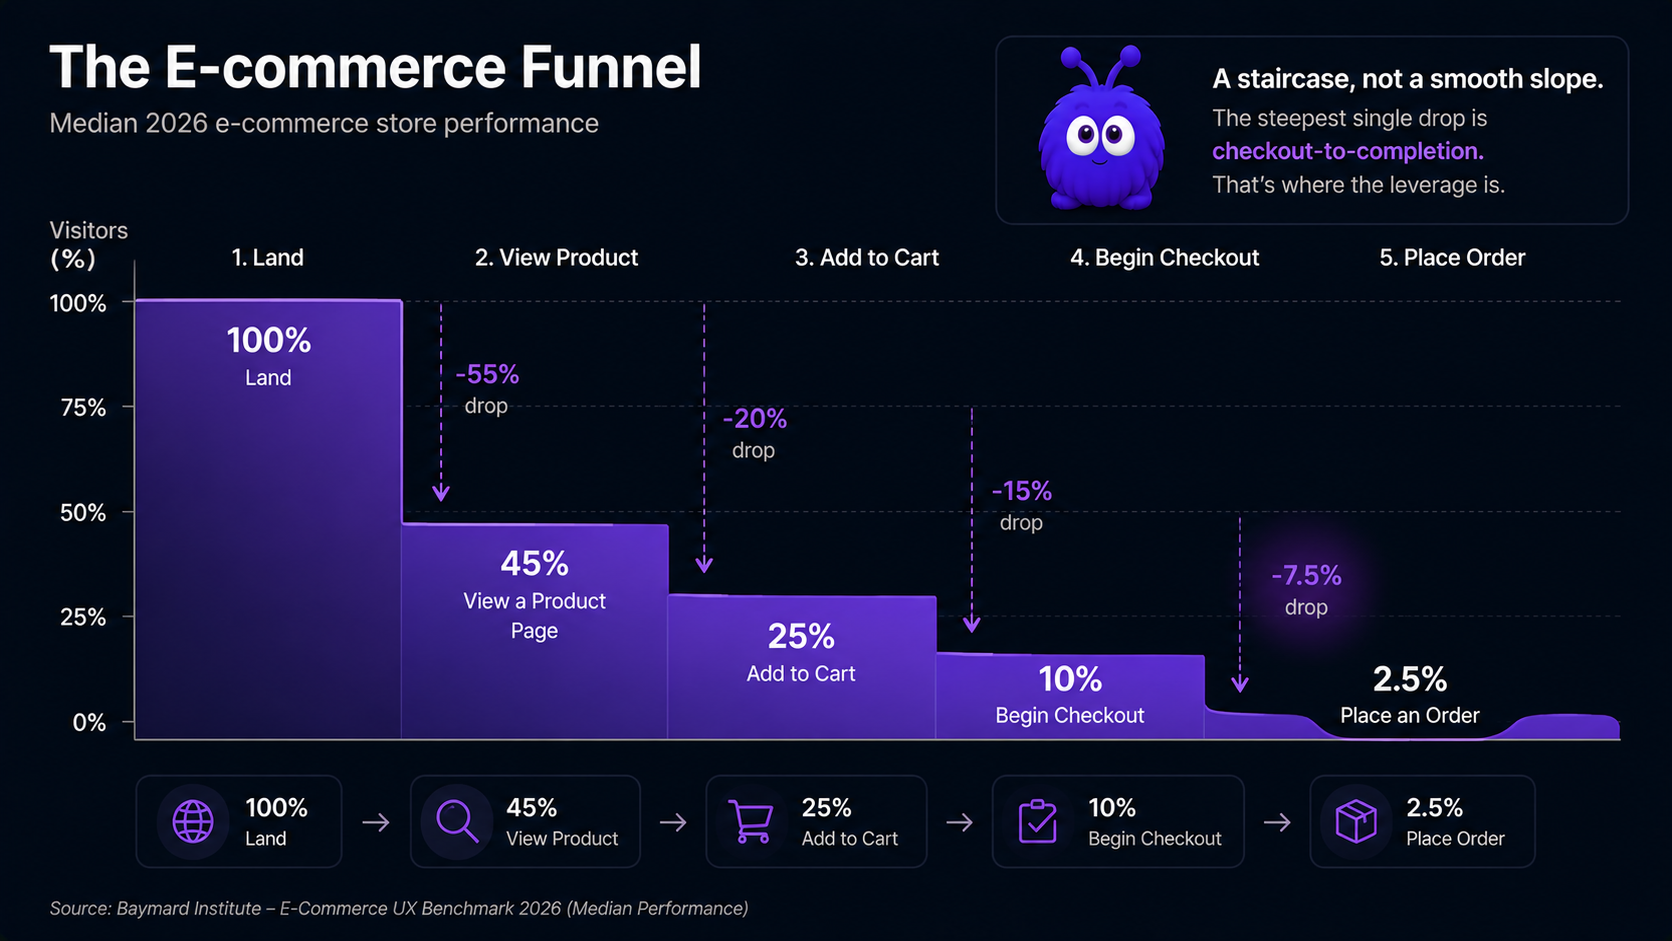
| 1. Landing (any page) | 100% | — | Baseline |
| 2. Product page view | 45% | 45% | Mismatched intent (ad / search to landing) |
| 3. Add to cart | 25% | 56% | Decision friction at PDP — clarity, choice, cost |
| 4. Begin checkout | 10% | 40% | Cart-stage hesitation — total reveal, comparison |
| 5. Order placed | 2.5% | 25% | Checkout friction — forms, payment, account |
Two things jump out. The shape is a staircase, not a smooth slope: the absolute drop grows at each stage (45 → 25 → 10 → 2.5), while the stage-to-stage rate bounces around (45%, 56%, 40%, 25%). The single biggest stage-to-stage drop is the last one, checkout-to-completion at 25%, which is why checkout work pays off out of proportion to its size. And the 2.5% overall is the median ecommerce conversion rate: below 1.5% means you are leaking somewhere fixable, above 4% means an unusually clean funnel or unusually high-intent traffic.
The shape moves with the traffic source. Paid social tends to drop faster early (landing-to-PDP closer to 35-40% than 45%) because the ad pointed people at the wrong page. Organic search tends to drop faster late (PDP-to-cart and beyond) because the visitor arrived informed but is comparison-shopping more than buying.
Where should I focus first if I have one quarter of CRO time?
On the biggest-volume drop, not the worst-looking percentage.
The temptation is to chase the ugliest number. Checkout-to-completion at 25% looks like the obvious target. But the math depends on how many people reach each stage. On a 1,000-visitor sample, lifting cart-to-checkout from 40% to 50% adds 25 checkouts, of which 25% complete, so +6.25 orders. Lifting checkout-to-completion from 25% to 35% on the 100 visitors who reach checkout adds +10 orders. The checkout-stage lift wins here, but the point is that you have to run the volume math rather than eyeball the percentage.
The general rule: multiply the percentage lift by the stage's incoming volume and pick the biggest product. For most stores in 2026 that lands in roughly this order, checkout stage first (biggest stage-to-stage drop, highest-leverage individual fixes, see checkout page optimization); cart stage second (second-largest drop, the most "almost-converters"); product detail page third (many small levers, see product page optimization); and landing-to-PDP last, since that is usually a traffic-quality problem, not a CRO one.
What's the difference between funnel CRO and ad-spend optimization?
Both move revenue, but they are complements with different scaling behavior, not substitutes.
Ad-spend optimization buys higher-quality visitors into the top of the funnel. The returns are real but bounded: at scale every campaign hits diminishing returns and the marginal session turns unprofitable. Funnel CRO converts more of the visitors already in the funnel, and the returns compound, because every CRO win lifts every traffic source at once.
The decision rule: if your funnel has known leaks (cart abandonment above the industry median, checkout completion under 40%, mobile CVR below 0.6x desktop), the marginal CRO dollar beats the marginal ad dollar. If your funnel is already clean (stage-to-stage rates matching Baymard's top quartile), spend on acquisition. Most stores think they are in the second group and are in the first, so audit before you assume.
What instrumentation do I need to actually see the funnel?
Three layers, all required.
Stage-level events to GA4 or equivalent. The standard set: view_item, add_to_cart, begin_checkout, add_payment_info, purchase. The most common failure is firing purchase on the order-confirmation page render instead of from a server-side webhook, which double-counts on reload or undercounts when someone closes the tab, off by 5-15%. A server-side purchase from the order webhook is the 2026 standard.
Session-level qualitative data. Hotjar, Microsoft Clarity (free), FullStory, or LogRocket. This layer answers why a drop happens. GA4 tells you 60% leave the cart; Clarity shows you they leave the moment shipping cost appears. Microsoft Clarity is the default for stores with no qualitative tooling, free, fast to install, and it integrates with GA4.
Server-side validation. Order data from the order-management system flowing back into analytics to confirm the front-end funnel matches reality. The check: do GA4 purchase events match the Shopify (or equivalent) order count for the same period? Diverge by more than 2% and the front-end funnel is lying, which means any CRO decision made from it is wrong.
These are not optional. A funnel analysis missing any of the three is deciding on partial data.
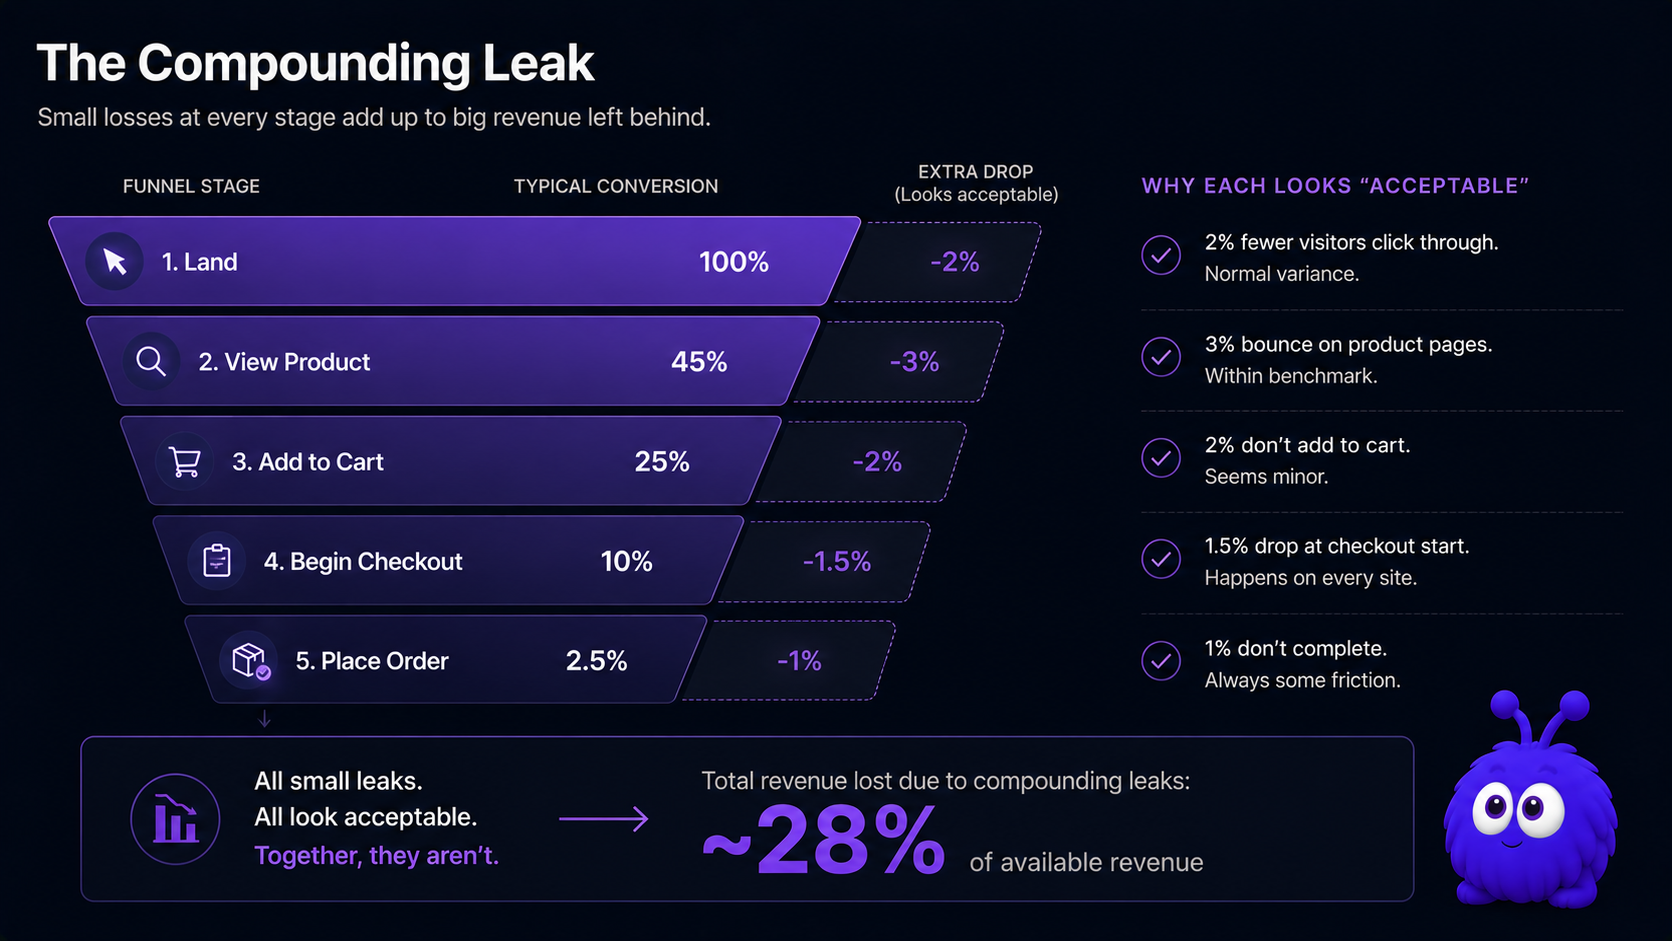
What is the compounding leak pattern?
It is a set of small drops at every stage that each look acceptable on their own but add up to a large loss. Picture a store leaking an extra 10% at every stage relative to the Baymard median: no single stage looks alarming, yet the system gives up about 28% of available revenue. Each drop is small enough to shrug at, which is exactly how a funnel bleeds out politely, one shrug at a time. The damage is invisible at any one stage, and that is exactly why teams underestimate it.
Diagnosis is mechanical: compare each stage's rate against the Baymard median, flag any stage 5+ points below, and prioritize the worst-and-largest. The compounding leak is not one broken thing; it is a discipline problem spread across many small ones.
Where does proactive chat fit in the funnel?
Mostly at the cart and checkout stages. Chat works best where intent is already formed but the friction is not yet resolved, which is structurally where the cart and checkout sit. For stage-1 and stage-2 problems the right lever is page architecture and ad targeting; for stage-3 and stage-4, chat is a high-leverage layer on top of the page-architecture fixes.
What this means for an operator running funnel analysis in 2026
Instrument before you analyze, all three layers, because without them the analysis is partial. Then volume-weight the priority: multiply percentage drop by stage volume and pick the biggest product, since the worst-looking percentage is rarely the biggest revenue opportunity.
The short version: the funnel is the map, the analysis is the diagnosis, and the intervention is the treatment. Most CRO programs jump straight from map to treatment without the diagnosis, and the work that follows is high-effort and low-yield.
Further reading
- GuideConversion-rate optimisation referenceThe broader CRO context the funnel analysis plugs into.
- GuideCart abandonment in 2026The cart-stage drop in detail.
- BlogCheckout page optimizationThe checkout-stage drop in detail.
- BlogProduct page optimizationThe PDP-stage drop in detail.
- ToolCart abandonment calculatorQuantify the cart-stage opportunity on your traffic.
- ToolConversion rate benchmarkerBenchmark your stage-to-stage rates against the Baymard 2026 panel.
Frequently asked questions
100% land → 45% PDP → 25% cart → 10% checkout → 2.5% complete. Median across the Baymard 2026 panel.
Last updated June 10, 2026.