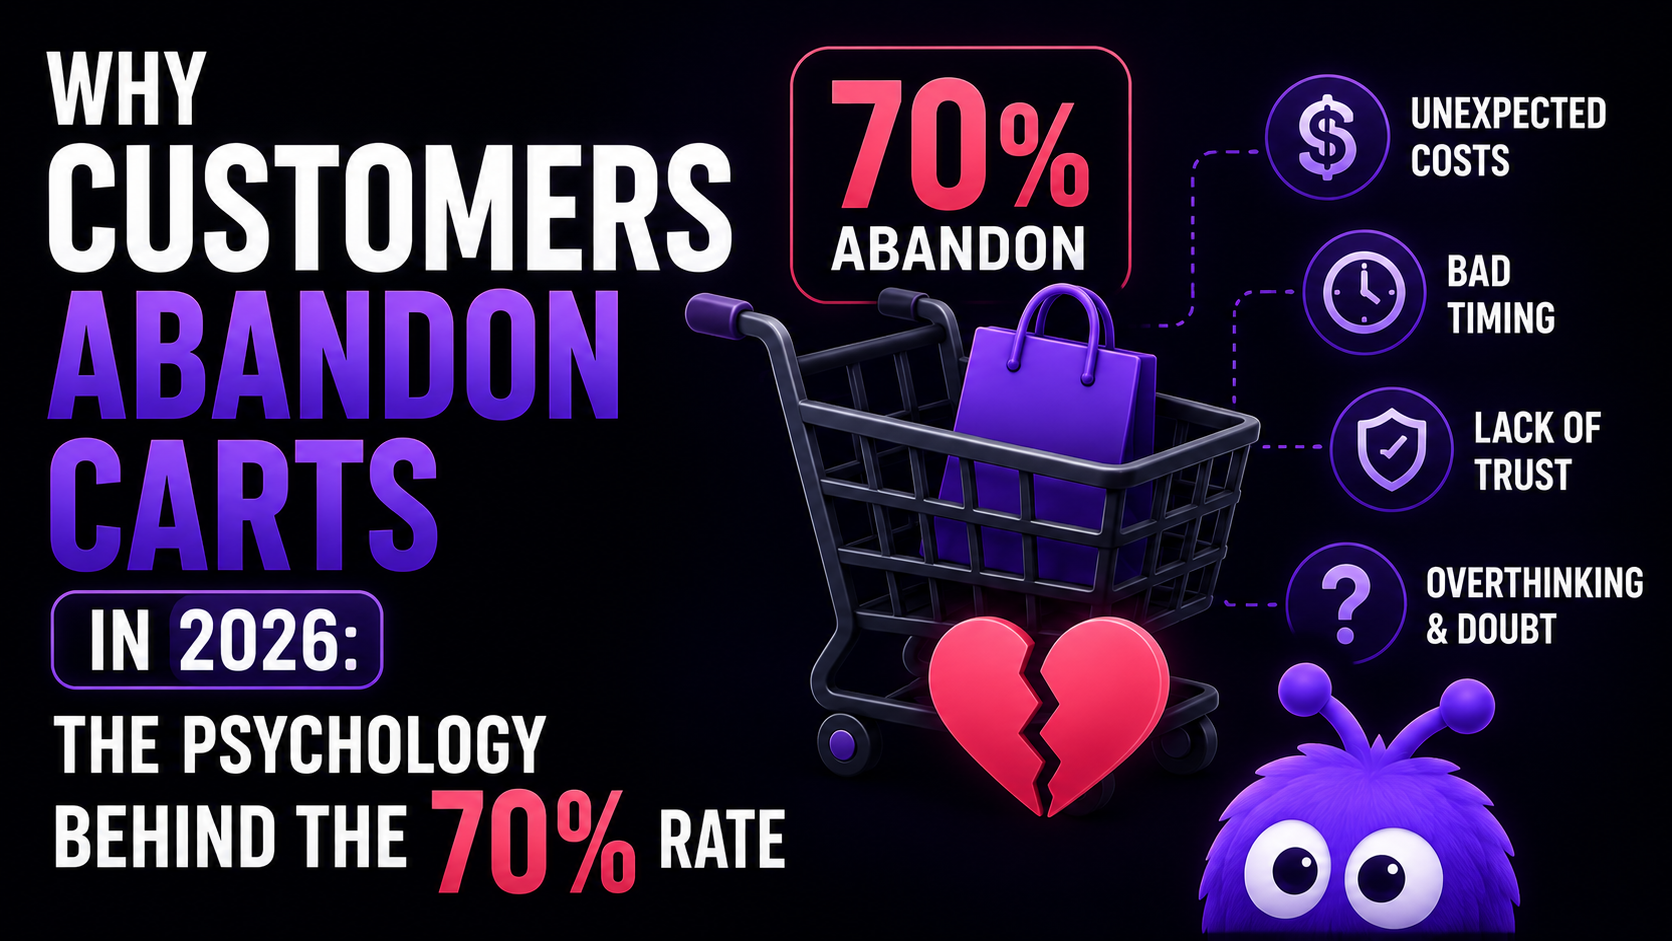
Cart abandonment is the most quoted — and most misquoted — number in ecommerce. Plenty of roundups circulate stats with no source, stale figures from a decade ago, or percentages that were simply invented. This page is the opposite: every number below links to its primary source, and we note the year it was published. When we update this page, we re-verify against the sources rather than copying our own previous numbers.
The headline rate
A few things worth knowing about that 70.22%:
- It is a meta-average across 50 separate studies, not a single dataset — individual studies range from the mid-50s to the low 80s (Baymard Institute).
- It has been remarkably stable: Statista's long-run series shows the worldwide rate climbing slowly since 2014 to just over 70% today.
- Stability in the headline hides movement underneath — the reasons people abandon shift far more than the rate itself.
Why shoppers abandon: the verified reason list
These are the reasons shoppers gave for abandoning a cart in Baymard's most recent published survey (respondents could select multiple reasons; the "just browsing" segment is excluded). Source: Baymard Institute, cart abandonment statistics.
| Reason | Share of abandoners |
|---|---|
| Extra costs too high (shipping, tax, fees) | 39% |
| Delivery was too slow | 21% |
| Didn't trust the site with credit card information | 19% |
| Site required account creation | 19% |
| Too long / complicated checkout process | 18% |
| Returns policy wasn't satisfactory | 15% |
| Website had errors / crashed | 15% |
| Couldn't see / calculate total order cost up-front | 14% |
| Not enough payment methods | 10% |
| Credit card was declined | 8% |
Two observations that matter more than any single row:
Cost transparency dominates. Add the extra-costs row to the can't-see-total row and more than half of stated friction is about the same thing: the total changed between the product page and the payment step. The psychology here is loss aversion — a surprise cost at checkout registers as a loss against the price the shopper anchored on, and losses weigh roughly twice as much as equivalent gains (Kahneman & Tversky's prospect theory, 1979). The fix is merchandising discipline, not a tool: show shipping and taxes as early as possible.
Most of this is fixable by design. Baymard's own conclusion from 15+ years of checkout usability testing is that the average large ecommerce site can improve conversion by about 35% solely through better checkout design — no pricing changes, no new traffic.
Mobile vs desktop abandonment
The mobile-desktop gap has persisted for years despite "mobile-first" redesigns, and the usual suspects are structural: smaller form inputs and autofill failures, more distracted contexts (commutes, social-media breaks), and higher perceived payment risk on a phone. Stores with strong express-checkout coverage — Shop Pay, Apple Pay, Google Pay — consistently see the smallest gaps, because a one-tap wallet removes the exact friction phones amplify.
Checkout friction, quantified
- The average checkout flow is 5.1 steps long and contains 11.3 form fields (Baymard via Contentsquare).
- Baymard's testing shows most checkouts can cut 20–60% of their default form fields without losing required information (Baymard Institute).
- 13% of customers will abandon if their preferred payment method isn't available (Contentsquare).
- 30% will leave if they have to re-enter credit card details (Contentsquare).
Recovery benchmarks: what happens after abandonment
- Abandoned-cart emails see open rates around 50% — several times typical marketing email performance (Klaviyo benchmark).
- Average click-through rate on cart abandonment emails: 23.33% (Contentsquare).
- Email recovers carts after the visitor leaves. The complementary lever is in-session intervention — catching the hesitation before the tab closes. That is the gap onsite conversion agents are built for, and the two approaches address different cohorts rather than competing.
How much abandonment is actually recoverable?
Be skeptical of any precise "X% of abandonment is recoverable" claim — including ones we have published in the past. What the evidence supports:
- A large share of abandonment is structural: browsing, comparison shopping, saving carts for later. No intervention recovers a shopper who never intended to buy this session.
- The remainder maps to the friction table above — and that portion is addressable, which is exactly why Baymard's measured ~35% conversion-improvement potential exists.
- The honest way to size your own opportunity: measure your abandonment rate, survey your abandoners (a one-question post-purchase "what almost stopped you?" works), and model the revenue with our cart abandonment calculator.
Methodology note
Stats pages age badly. Our rules for this one: every number links to a primary source; we quote the source's current published figure rather than an older viral version of it (Baymard's reason percentages, for example, are frequently misquoted from their 2022–24 survey — the current published figures are the ones above); and when we publish our own measured data from Yokaify beta stores, it will be labeled as ours with methodology attached, in a dedicated research section.
Further reading
- ToolCart abandonment calculatorModel the recoverable revenue on your own numbers.
- ToolPost-purchase survey builderSurvey abandoners to find your dominant friction.
- GuideThe cart-abandonment recovery playbookThe full recovery framework.
- BlogCheckout optimizationFixes ranked by impact.
- GlossaryAverage order value (AOV)The definition and levers behind the revenue math above.
All statistics re-verified against their sources on July 6, 2026.