The cart abandonment rate has been ecommerce's headline number for fifteen years, and it barely moves. What moves is the psychology underneath it. The 2026 shopper is more skeptical of AI, more attentive to sustainability, and more easily worn down by too many choices. Knowing which kind of shopper drives which reason is what tells you which intervention is worth running.
This post covers the 2026 reason breakdown, the difference between structural and recoverable abandonment, and how to match an intervention to a reason.
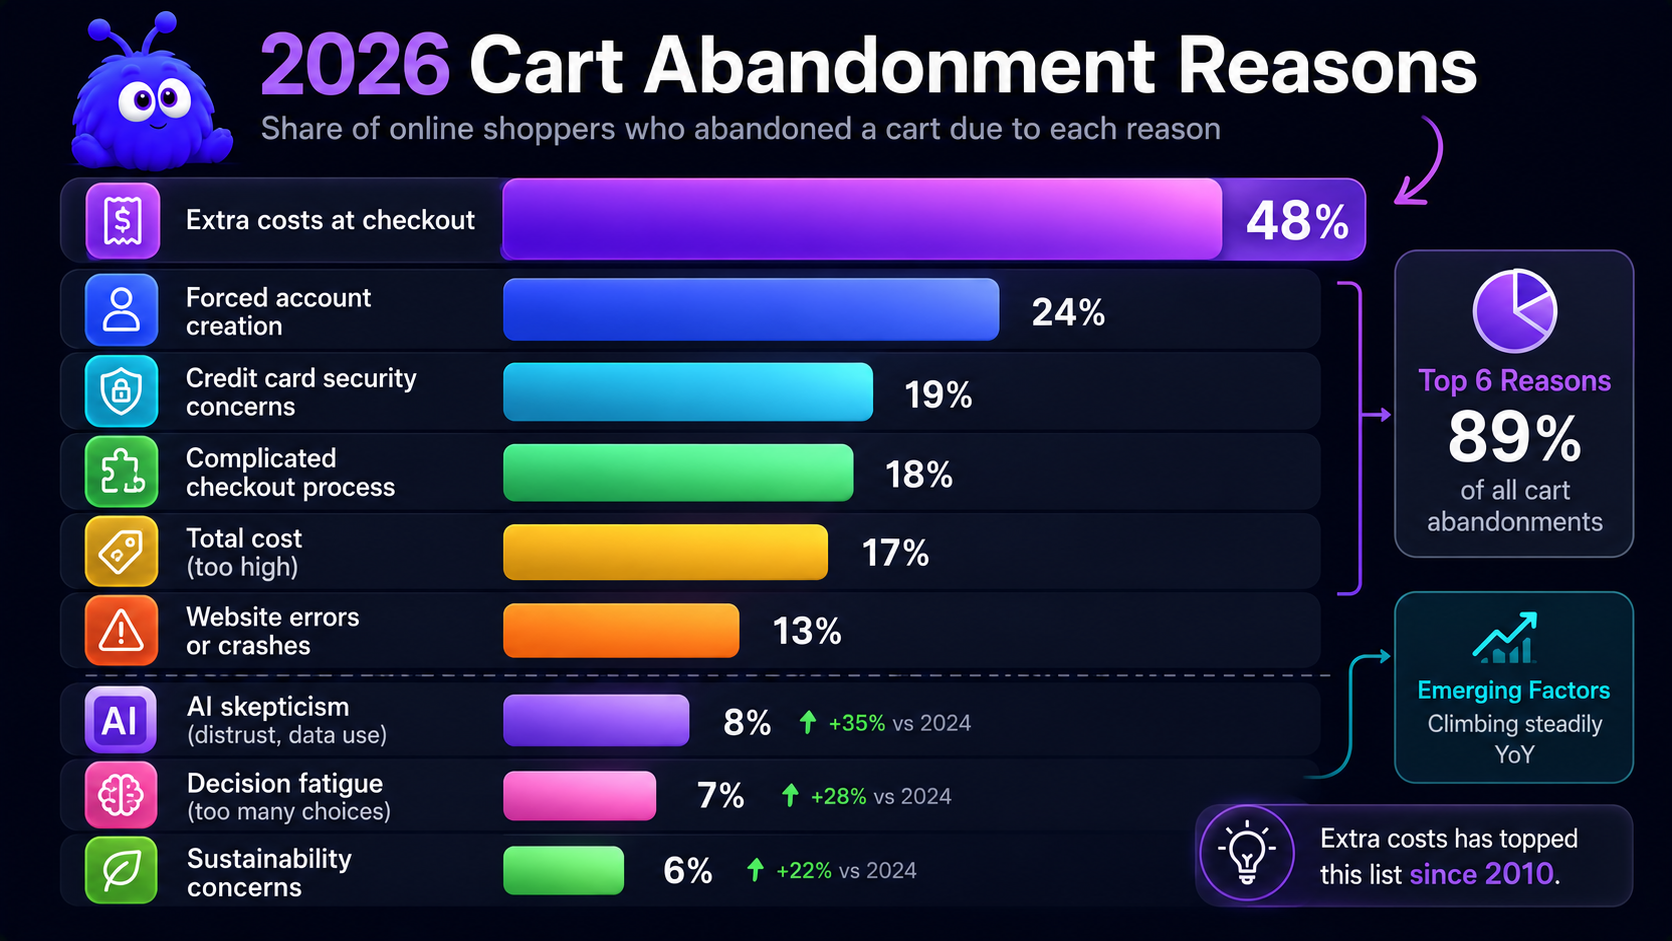
What are the 2026 reasons people abandon carts?
Extra costs at checkout, shipping, tax, and fees, lead the list, cited by 48% of abandoners (Baymard Institute, 2026). Forced account creation follows at 24%, then credit-card security concerns at 19%, a complicated checkout at 18%, a total that came in higher than expected at 17%, and website errors or crashes at 13%. The percentages sum above 100% because shoppers cite more than one reason. Extra costs has been the top reason since 2010 and still is.
Set aside the people who were never going to buy this session, the browsers and the comparison shoppers, and the rest of the list describes friction someone could have removed.
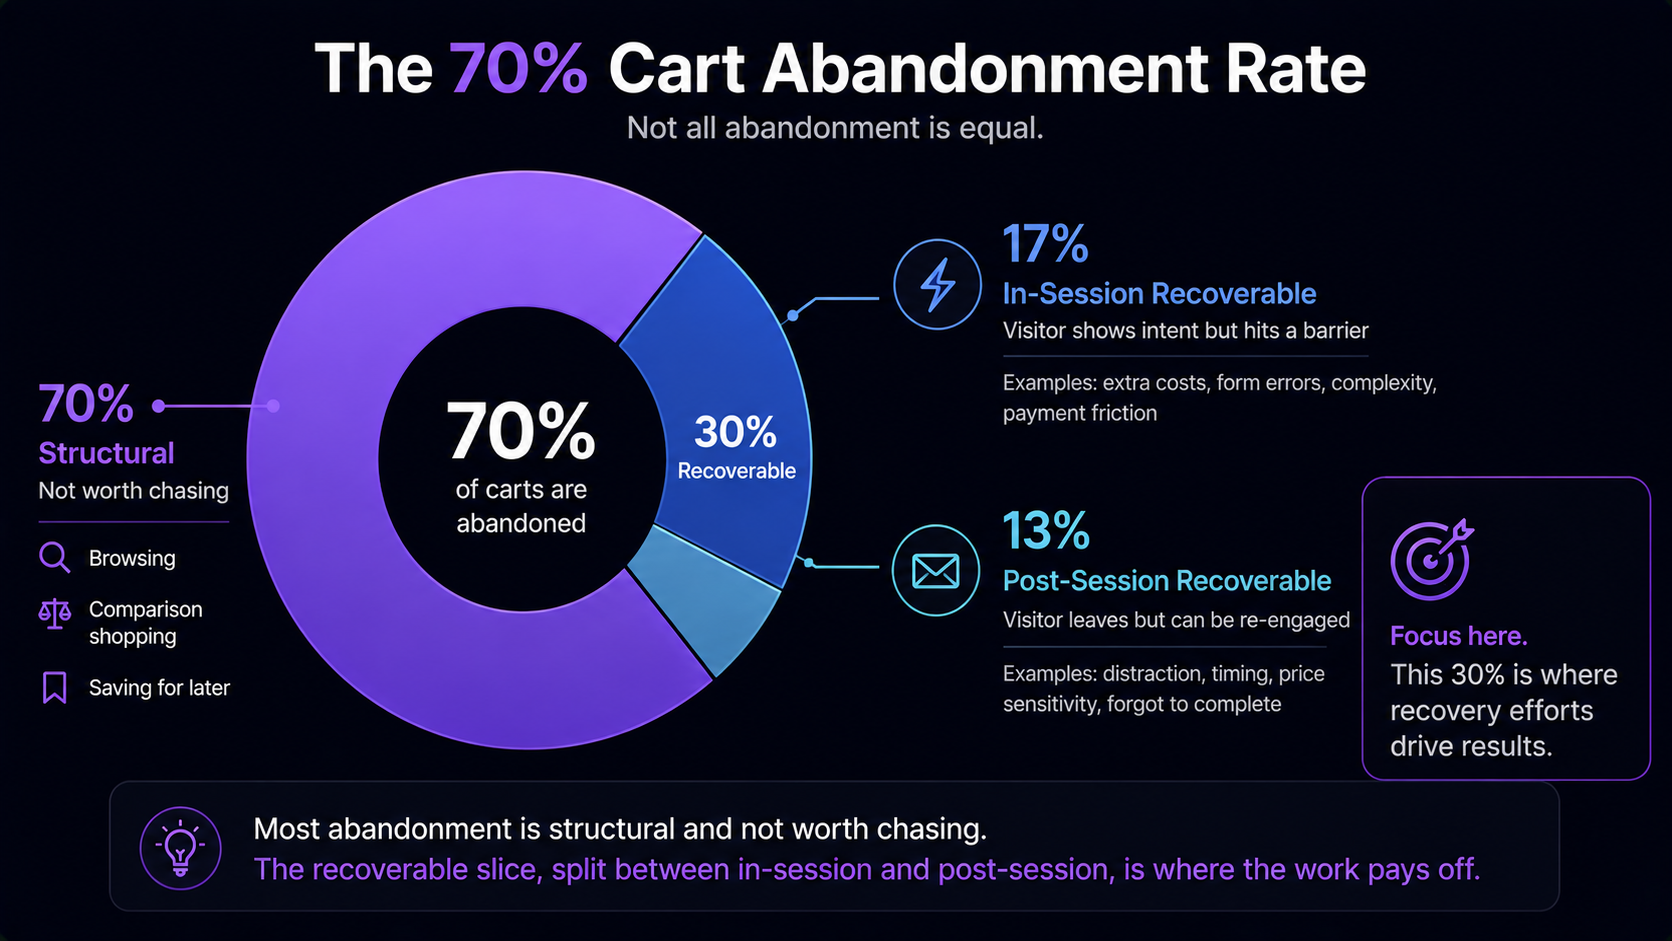
How much cart abandonment is actually recoverable?
The 70% splits into two very different groups.
Structural abandonment is roughly 60-70% of abandoners: browsing, comparison shopping, saving for later, adding on mobile to buy later, never intending to purchase at all. You cannot recover this group, and spending intervention budget on them is like running after someone who only ducked into the shop to get out of the rain.
Recoverable abandonment is the other 30-40%: real intent that hit a removable barrier. These are the people who wanted to buy and ran into something. Intervention works here.
Out of the full 70%, that means roughly a quarter is genuinely recoverable. About half of that can be recovered in the session itself; the rest after the session, through email or another channel.
Why do extra costs dominate the reasons?
The mechanism is loss aversion (Kahneman and Tversky, 1979). The shopper sees a product at price X, forms an expectation that the total will land near X, adds to cart, and heads to checkout. When the total jumps, the gap registers as a loss, and a loss lands roughly twice as hard as an equivalent gain.
So the fix is not to lower the costs. It is to set the expectation early: show shipping on the product page, disclose tax in the cart, and make the free-shipping threshold visible before checkout.
The cart abandonment calculator models the lift, and the cart-abandonment guide covers the broader recovery framework.
Why is mobile cart abandonment higher than desktop?
Mobile runs 78-82% against desktop's 62-68%, and the 14-point gap is structural.
Forms are harder on a phone. Smaller inputs, autofill that fails more often, an on-screen keyboard eating half the viewport. Every field is a higher-friction interaction.
The context is more distracted. Mobile visits happen on commutes, in social-media breaks, between meetings. Sessions get interrupted, so a lot of mobile "abandonment" is really partial completion that finishes later.
Risk perception is higher. Shoppers are warier about entering card details on a phone, partly for accurate reasons (public Wi-Fi, people nearby) and partly out of inherited habit.
Stores with solid express-checkout coverage (Shop Pay, Apple Pay, Google Pay) see much less of this penalty.
What new factors emerged in 2026?
AI-skepticism. 11% of abandoners now cite distrust of AI-driven elements, up from 4% in 2023. Shoppers recognise AI chatbots, personalised pricing, and recommendation engines, and some read them as manipulative. The counter is continuity that reads as deliberate brand voice rather than algorithmic surveillance, which is part of why a brand-matched mascot lands differently than a generic chat bubble. The onsite conversion agent compared to chatbots page covers that positioning.
Sustainability friction. 8% cite carbon-shipping or packaging-waste concerns, up from 2% in 2023. The group is specific, often younger, often in EU markets, and it responds to sustainable packaging options, carbon-offset add-ons, and slower-but-greener shipping choices at checkout.
Decision fatigue. 14% cite too many options, up from 9%. As catalogs ballooned, comparison got harder, and shoppers bail when the effort of choosing outweighs the value of finishing. The counter is narrowing the choice: recommendation engines, clear "best for you" framing, and tools like the activation calculator to find which decision is actually the binding one.
How does cart abandonment differ by category?
The dominant reason shifts by category, and so should the intervention. Apparel sits around 67% with fit and sizing as the main worry; electronics around 73%, driven by price comparison; travel and hospitality around 81%, where uncertainty about flexibility looms large; B2B and wholesale around 84%, where much of the "abandonment" is just normal RFQ evaluation. A B2B store firing aggressive recovery emails at buyers who are simply working a quote is wasting effort, while a sizing-help intervention on an apparel store is aimed right at the friction.
Which intervention fits which reason?
Most stores do best with a small set of interventions, the ones that match their category's dominant friction. Trying to run every intervention at once piles on cost without a matching lift, so the move is to pick by category fit rather than to cover everything.
What this means for buyers
A few takeaways:
- Decompose your own abandonment. Survey abandoners (a post-purchase "what almost stopped you?"), measure your category-specific rate, and find your dominant reason. That reason tells you which intervention to run.
- Pre-empt the extra-cost reveal. The single biggest fix is showing total cost early. No vendor required, just merchandising discipline.
- Layer interventions without overlap. Pre-checkout transparency, in-session help, and a post-abandonment email each address a different group. Two of the three with a measurement holdout produce a lift you can actually see; all three without measurement produce only a marketing claim.
The 70% rate is part structural and part recoverable, and the recoverable part is real but bounded. Work it and conversion improves steadily; chase the structural part and you hit diminishing returns fast.
Further reading
- ToolCart abandonment calculatorModel the recoverable revenue.
- ToolPost-purchase survey builderSurvey abandoners to measure your specific cohort breakdown.
- GlossaryCart abandonmentThe definitional reference.
- GlossaryIntent signalHow to identify the recoverable cohort.
- GuideThe 2026 cart-abandonment recovery playbookThe full recovery framework.
Frequently asked questions
70.19% globally per Baymard Institute. Mobile 78-82%; desktop 62-68%.
Last updated June 10, 2026.